The Problem:
A large porphyry operation in Chile with a conventional SAG mill and ball mill grinding circuit followed by a flotation circuit sought to improve operational performance using digital solutions. But the operation considered their input data to be of low quality.
There is a persistent perception in industry that mining data is lacking and of low quality and therefore will generate ineffective and poor prediction models.
The concerns included insufficient data (missing data), data of poor quality (erroneous fields and strings) or data that was just wrong (values are not accurate). This was compounded by the fact that data was located and stored in many disparate systems and databases.
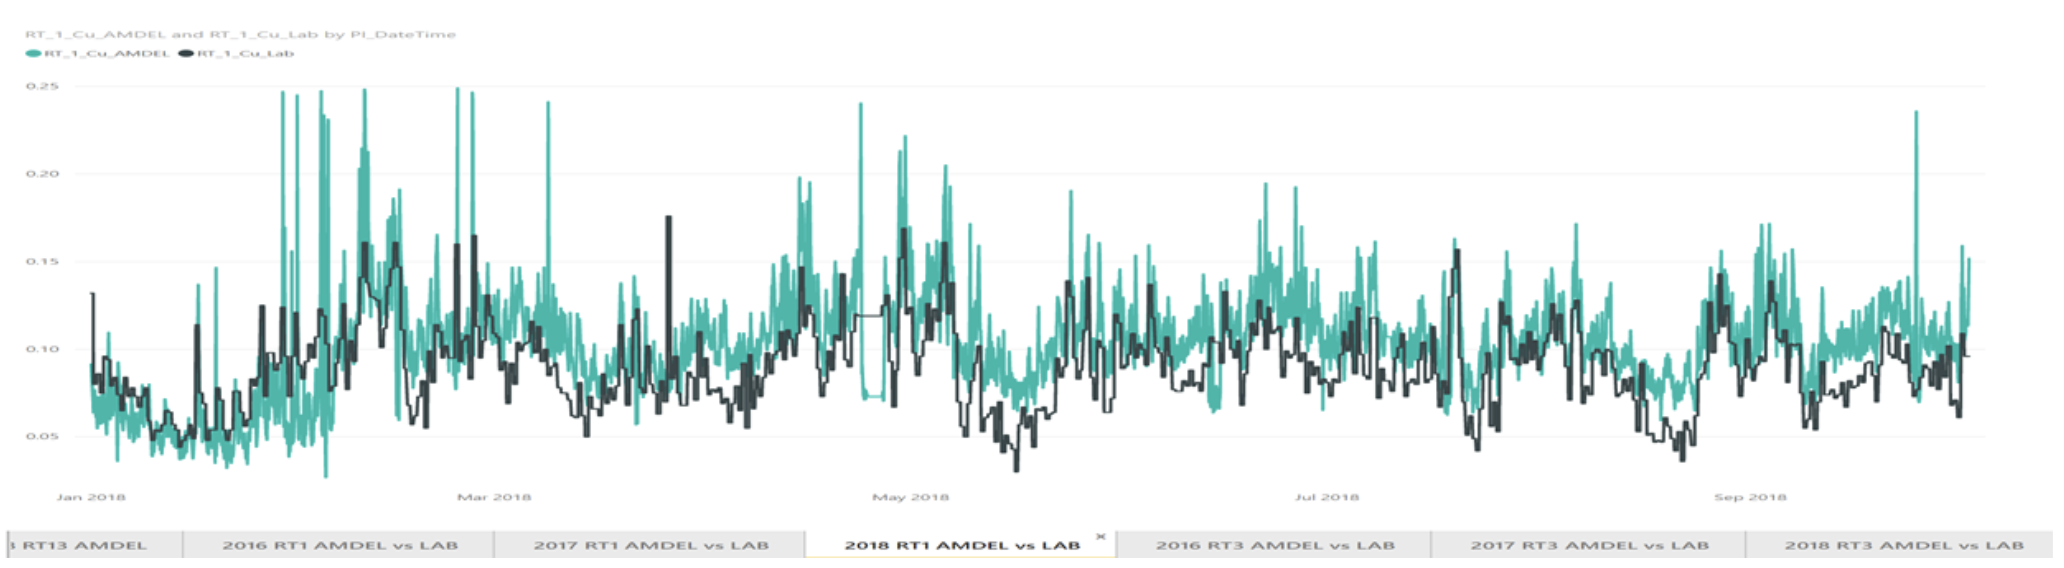
PETRA was tasked with assessing the integrity of inputs to a machine learning model, that being the continuous data coming from instruments and sensors in the plant. One of the strongest or most significant inputs to a machine learning prediction model was found to be metal content as determined by the on-stream-analyser (OSA). Although this is a rich and informative data stream with assays recorded every few minutes, the data is erratic and in many instances does not align with laboratory assay results from composite shift samples.
The Solution:
MAXTAProcess was the chosen solution as it is a purpose built automated mathematical algorithm ready to tackle the following issues and included:
- The management of data coming from key online sensors such as those coming from on stream analysers and particle size indicators (PSIs) with data from control laboratory samples, example described here.
- Software to automatically clean data by automatically removing erroneous entries such as #NA or blank fields.
- Monitoring online sensors for anomalies to trigger real-time alerts and sensor health for model inputs.
- Automated real-time model switching contingent upon sensor health for model inputs.
PETRA worked with the site personnel to understand and quantify the variation in key OSA data. Using the composite shift assay as a source of truth, corrections and calibrations were applied to the real-time OSA outputs to ensure closer alignment with the truth shift sample results.
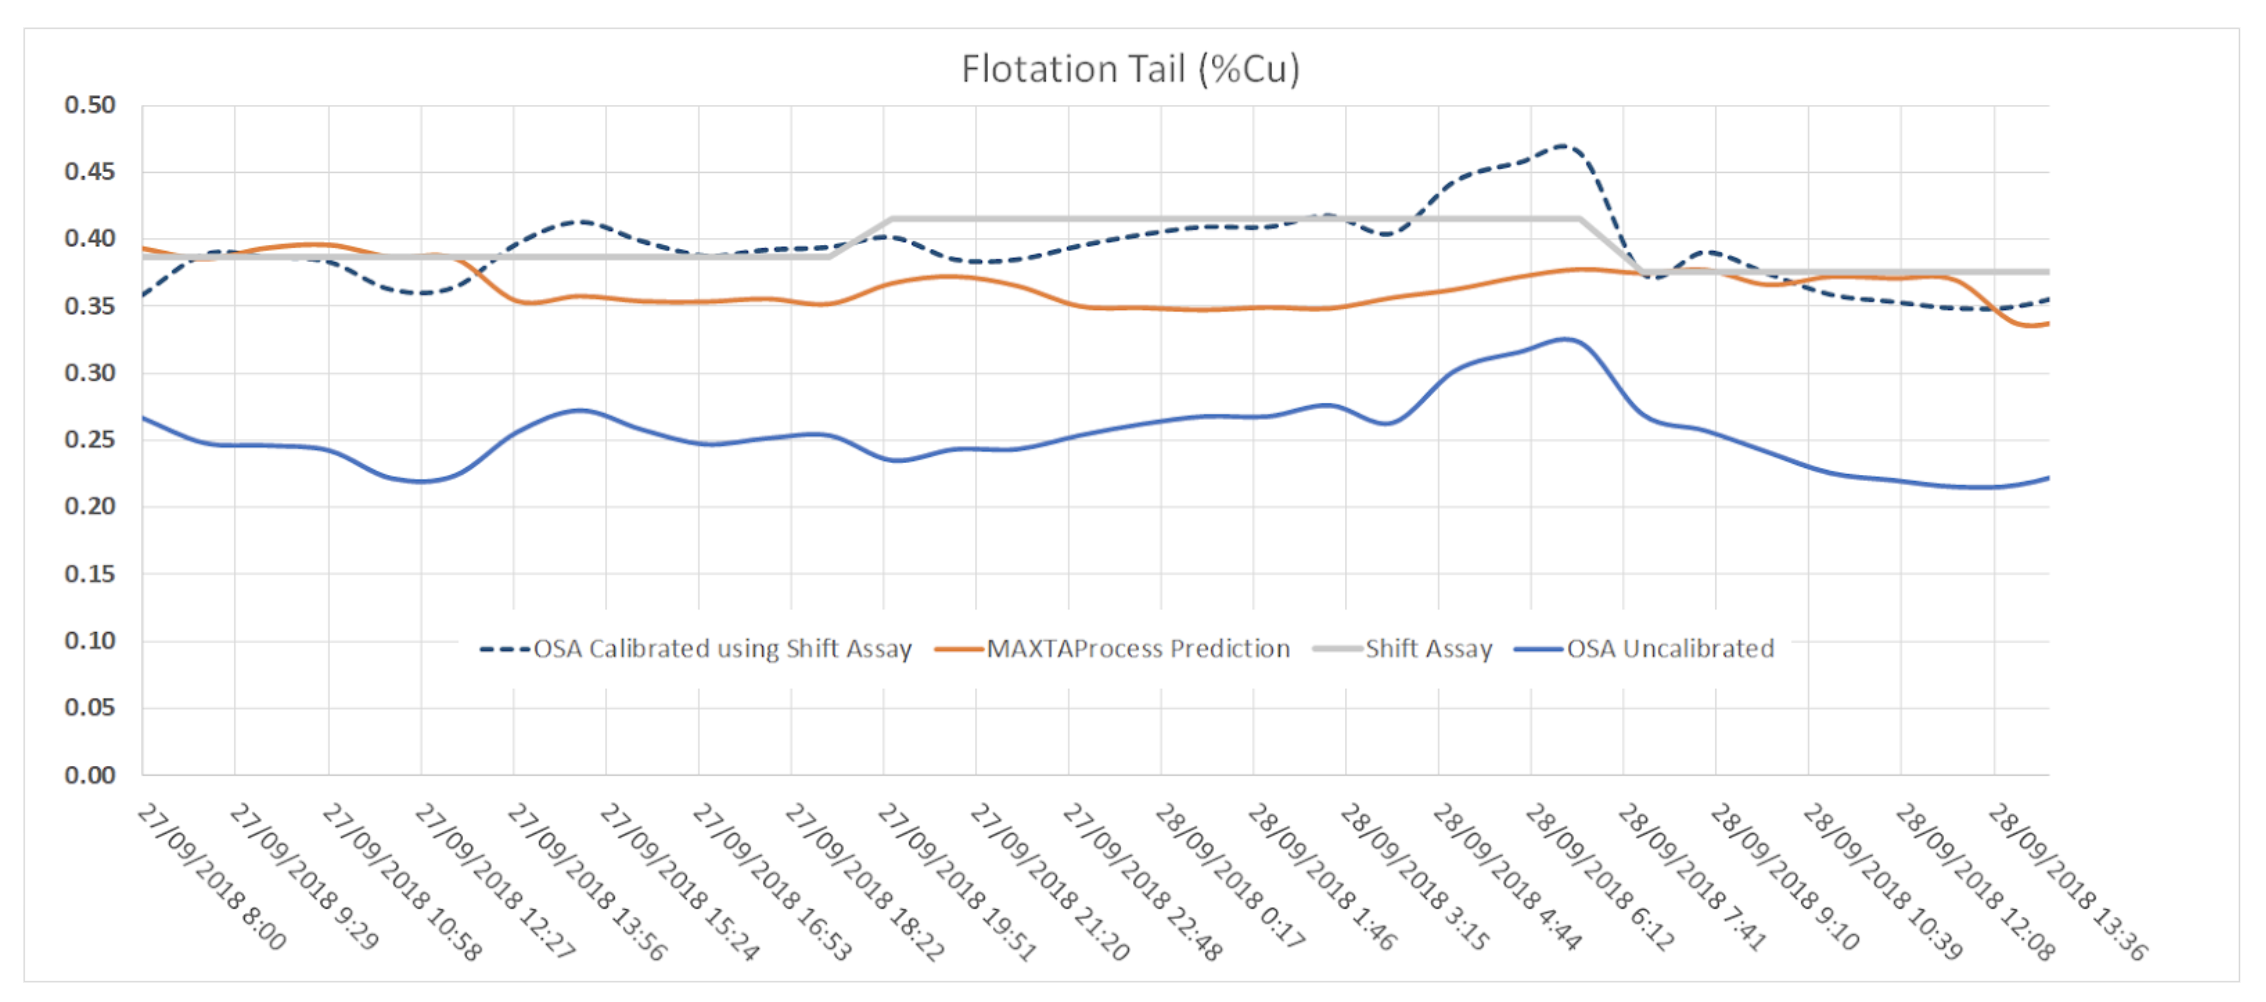
The calibration approach was determined according to historic correlation between OSA and shift assay results and with the same correction projected 12 hours ahead, the process was repeated as shift composite assays were recorded.
This bestowed more faith in the relatime OSA values and facilitated more accurate predictions models using MAXTAProcess as inputs to the models were deemed more accurate.
The implementation and deployment of MAXTAProcess involved close collaboration with the site process control team as well as the site metallurgists. It was conducted over a period of 16 weeks from the receipt of operating data to the deployment of MAXTAProcess.
The Results:
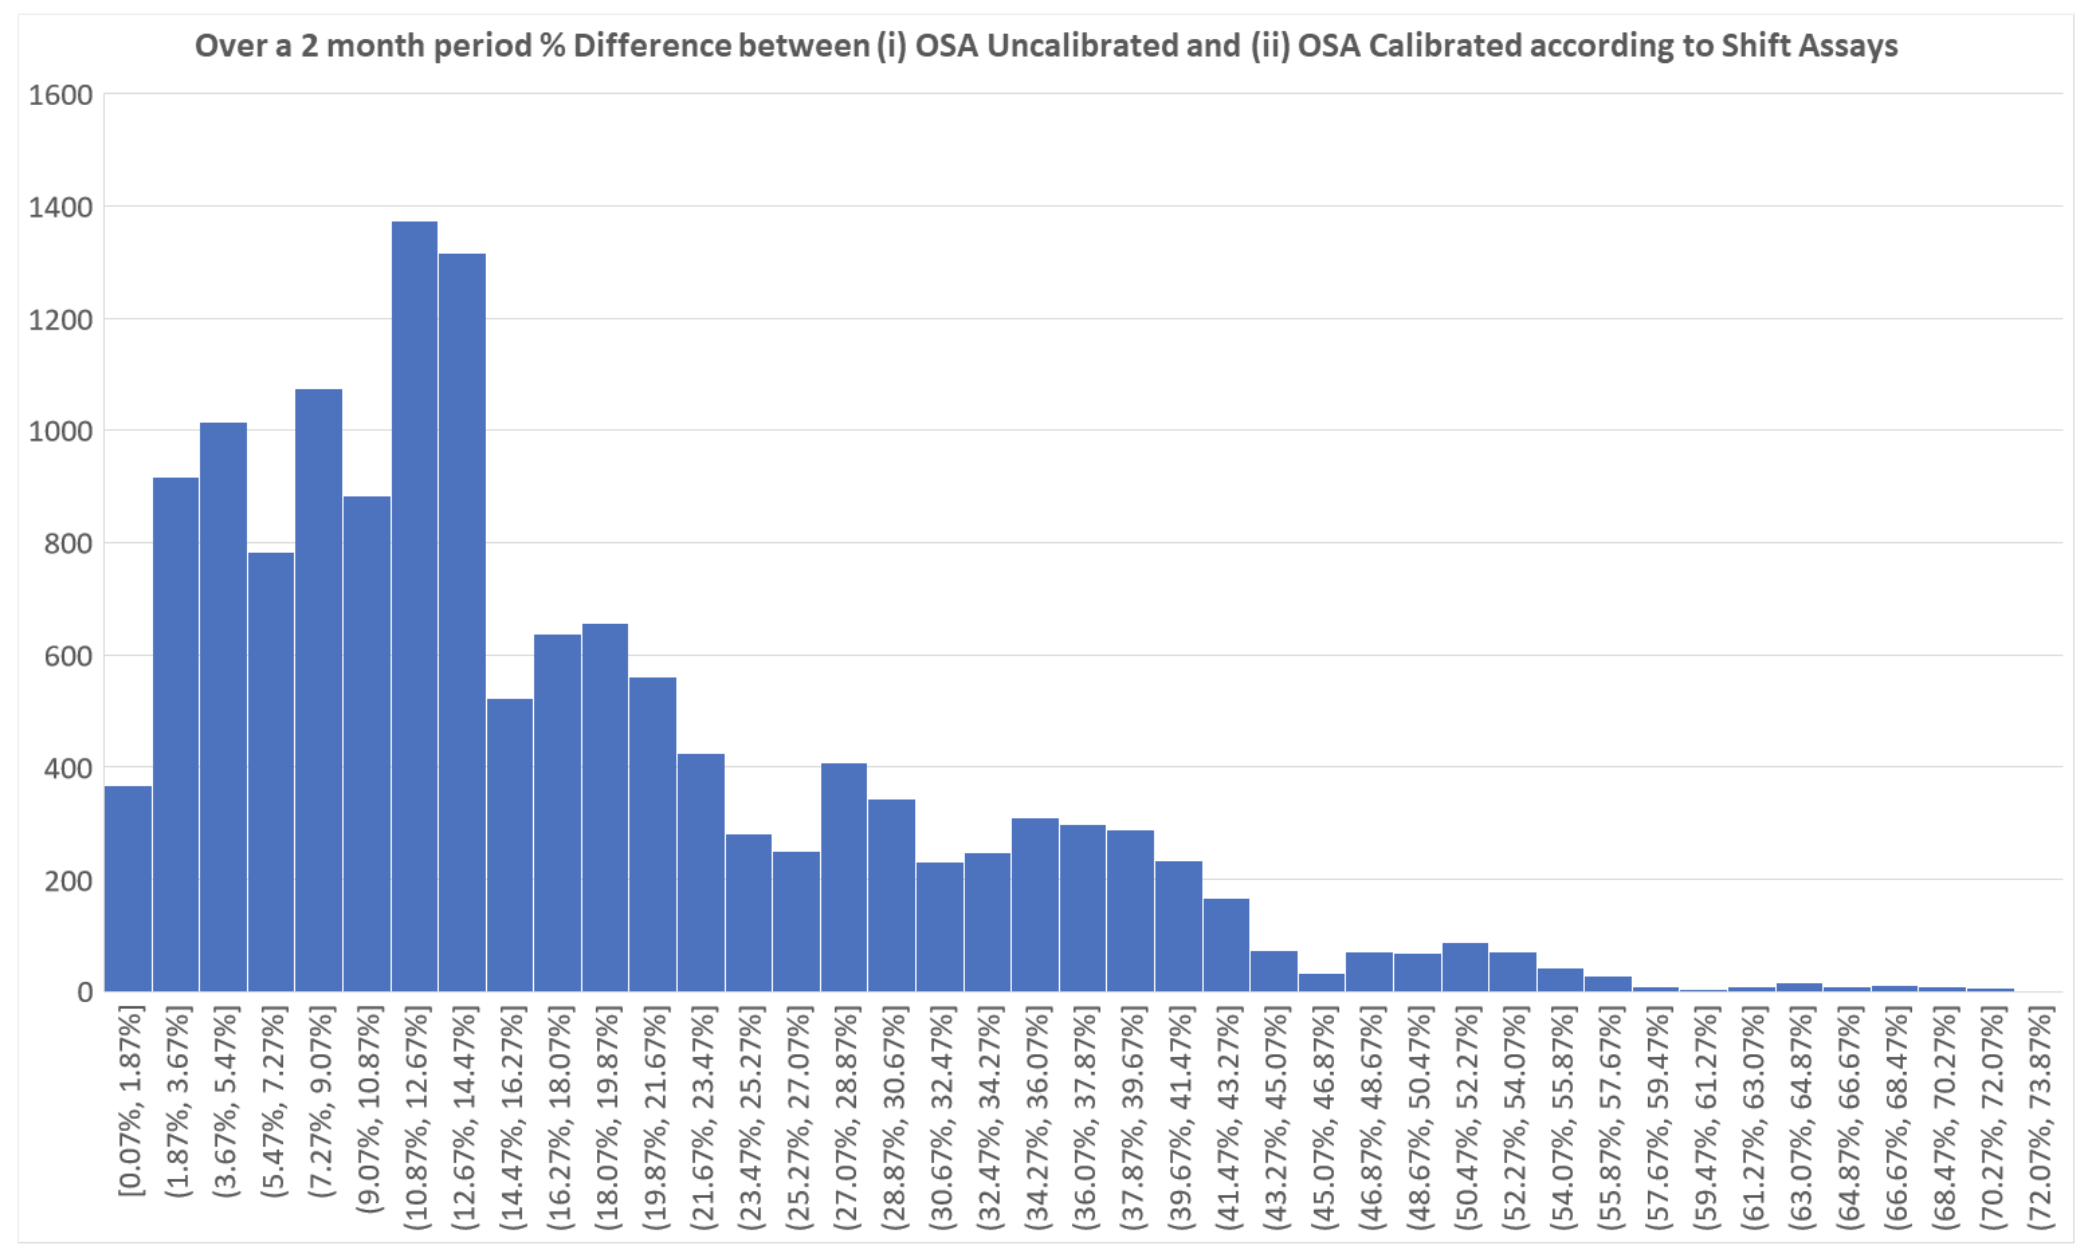
Analysis over a two month period showed that the majority of the time a 2% to 10% difference exists between real-time OSA data generated at 5 minute intervals and OSA data calibrated according to composite shift assay results (truth data).
But the operation considered their input data to be of low quality instrument data, in this case OSA values, not only provided operators with a more reliable and accurate indicator of plant performance it also provided more accurate key inputs to machine learning prediction models used in MAXTAProcess.
MAXTA is available now for demonstration, please contact us to arrange a walk through.
